SGI Enhanced Market Leaders ETF

March 13, 2026

CURRENT MATERIALS

CURRENT MATERIALS

Overview

INCEPTION
05/05/2025
OBJECTIVE
Seek Capital Appreciation and Income
TICKER
LDRX
PRIMARY EXCHANGE
NASDAQ
CUSIP
74933W189
NET ASSETS
$207,272,934.06
PREMIUM/DISCOUNT1
0.05%
30 DAY MEDIAN BID/ASK SPREAD2
0.25%
GROSS EXPENSE RATIO
0.50%

Market Leaders and Enhanced Yield

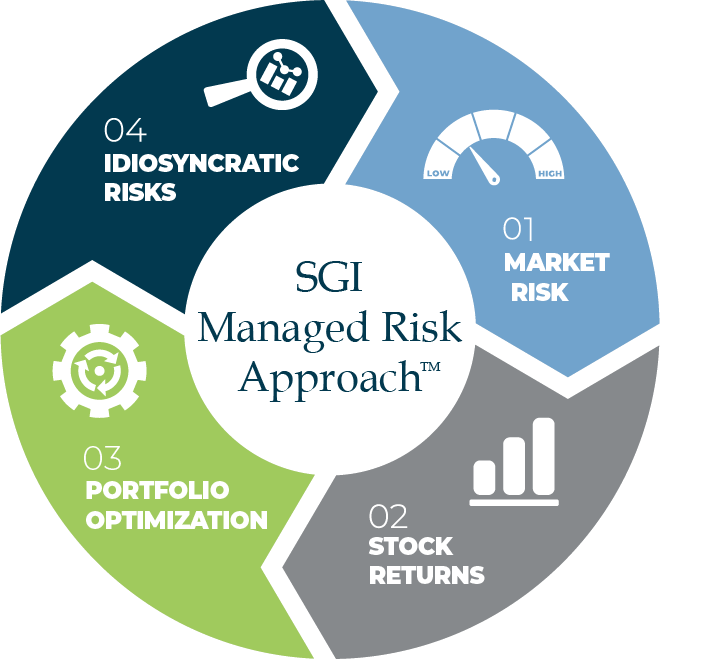
LDRX seeks to deliver enhanced income and capital appreciation by investing in stocks of companies it considers “market leaders”. The portfolio focuses on companies with consistent leadership in earnings, debt, and valuations, and adjusts positions based on changing risk/return profiles and idiosyncratic risks.

This active strategy aims to generate an “enhanced yield” by an options overlay. This approach seeks to generate income from premiums while keeping costs low.

LDRX may also invest in ETFs and other funds to support diversification and liquidity. With risk management at its core, the strategy seeks equity growth with income generation through options.

Why invest in LDRX?

Income Generation

Designed for investors looking to experience income derived from two distinct sets of holdings: 1) dividends that are generated from a diversified portfolio of global equities that historically generate attractive dividends, and 2) an enhanced income component derived from an ultra-short-term options strategy that seeks to provide additional daily income.

Risk Management

Managed Risk ApproachTM utilizes dynamic hedging through call options or underlying futures.

Experienced Investment Team

SGI Portfolio Managers have deep expertise in multi-asset income investing, including asset allocation, tactical positioning, and rigorous research.

Managed Risk Approach

Performance

DAILY PERFORMANCE
AS OF 2026-03-13

NAV
PRICE
$ Change
$31.24
$31.25
% Change
-0.91%
-0.92%

Performance data quoted represents past performance. Past performance does not guarantee future results. Investment return and principal value will fluctuate so that shares, when redeemed, may be worth more or less than the performance shown. Current performance may be lower or higher than that shown here. For performance current to the most recent month-end, please call 855-744-8500.

Portfolio Managers

Aash M. Shah, CFA

Head of Investments & Sr. Portfolio Manager

David Harden, Founder

President | Portfolio Manager | Chief Executive Officer | Chief Investment Officer

Holdings as of 2026-03-13

Name
Ticker
CUSIP
Shares
Weight
Market Value
NVIDIA Corp
NVDA
67066G104
125827
10.94%
$22,680,316.75
Apple Inc
AAPL
037833100
76181
9.19%
$19,054,391.72
Alphabet Inc
GOOGL
02079K305
53681
7.83%
$16,226,692.68
Microsoft Corp
MSFT
594918104
37893
7.23%
$14,988,576.15
Amazon.com Inc
AMZN
023135106
49537
4.96%
$10,287,348.79
Broadcom Inc
AVGO
11135F101
24246
3.77%
$7,811,091.36
Meta Platforms Inc
META
30303M102
11059
3.27%
$6,781,212.92
Tesla Inc
TSLA
88160R101
14361
2.71%
$5,618,023.20
Berkshire Hathaway Inc
BRK/B
084670702
9677
2.29%
$4,742,020.31
JPMORGAN CHASE & CO.
JPM
46625H100
14309
1.96%
$4,055,742.96
Eli Lilly & Co
LLY
532457108
4091
1.94%
$4,029,962.28
Exxon Mobil Corp
XOM
30231G102
21773
1.64%
$3,399,200.76
Johnson & Johnson
JNJ
478160104
12749
1.49%
$3,079,138.48
Visa Inc
V
92826C839
8731
1.29%
$2,681,639.34
First American Government Obligations Fund
FGXXX
31846V336
2227799.65
1.07%
$2,227,799.65
Costco Wholesale Corp
COST
22160K105
2191
1.07%
$2,209,470.13
Mastercard Inc
MA
57636Q104
4227
1.02%
$2,105,003.73
Netflix Inc
NFLX
64110L106
22012
1.01%
$2,097,963.72
AbbVie Inc
ABBV
00287Y109
9425
1.00%
$2,070,484.00
Chevron Corp
CVX
166764100
9931
0.94%
$1,954,619.42
Procter & Gamble Co/The
PG
742718109
12473
0.91%
$1,879,057.45
Home Depot Inc/The
HD
437076102
5172
0.85%
$1,753,463.16
Palantir Technologies Inc
PLTR
69608A108
11515
0.84%
$1,738,189.25
Bank of America Corp
BAC
060505104
35611
0.80%
$1,663,745.92
Caterpillar Inc
CAT
149123101
2396
0.80%
$1,662,800.04
GE AEROSPACE
GE
369604301
5425
0.78%
$1,625,818.25
Cisco Systems Inc
CSCO
17275R102
20606
0.78%
$1,614,067.98
Advanced Micro Devices Inc
AMD
007903107
8329
0.78%
$1,610,745.31
Coca-Cola Co/The
KO
191216100
20159
0.75%
$1,559,097.06
Merck & Co Inc
MRK
58933Y105
12945
0.72%
$1,485,568.20
Philip Morris International Inc
PM
718172109
8323
0.70%
$1,453,695.18
Walmart Inc
WMT
931142103
11385
0.69%
$1,440,430.20
Oracle Corp
ORCL
68389X105
8541
0.64%
$1,324,794.51
UnitedHealth Group Inc
UNH
91324P102
4686
0.64%
$1,321,873.74
RTX Corp
RTX
75513E101
6286
0.62%
$1,285,612.72
Wells Fargo & Co
WFC
949746101
16593
0.59%
$1,229,541.30
McDonald's Corp
MCD
580135101
3673
0.58%
$1,199,087.58
Goldman Sachs Group Inc/The
GS
38141G104
1515
0.57%
$1,185,048.15
Verizon Communications Inc
VZ
92343V104
22981
0.57%
$1,180,763.78
Linde PLC
LIN
G54950103
2385
0.57%
$1,177,999.20
PepsiCo Inc
PEP
713448108
7147
0.55%
$1,142,662.36
International Business Machines Corp
IBM
459200101
4615
0.55%
$1,136,582.20
AT&T Inc
T
00206R102
38854
0.52%
$1,077,032.88
Amgen Inc
AMGN
031162100
2926
0.52%
$1,071,530.46
Abbott Laboratories
ABT
002824100
9418
0.49%
$1,017,426.54
Intel Corp
INTC
458140100
22151
0.49%
$1,013,851.27
Citigroup Inc
C
172967424
9590
0.49%
$1,013,567.10
NextEra Energy Inc
NEE
65339F101
10894
0.49%
$1,010,745.32
Gilead Sciences Inc
GILD
375558103
6756
0.47%
$979,552.44
Morgan Stanley
MS
617446448
6229
0.47%
$964,685.23
Texas Instruments Inc
TXN
882508104
4952
0.46%
$944,742.56
Salesforce Inc
CRM
79466L302
4870
0.45%
$939,082.10
Walt Disney Co/The
DIS
254687106
9387
0.45%
$932,035.23
Thermo Fisher Scientific Inc
TMO
883556102
1881
0.42%
$873,479.97
Charles Schwab Corp/The
SCHW
808513105
8901
0.40%
$828,327.06
American Express Co
AXP
025816109
2723
0.39%
$816,791.08
Pfizer Inc
PFE
717081103
30105
0.39%
$800,190.90
Uber Technologies Inc
UBER
90353T100
10780
0.38%
$790,497.40
Union Pacific Corp
UNP
907818108
3251
0.38%
$788,172.44
Boeing Co/The
BA
097023105
3736
0.38%
$784,149.04
ConocoPhillips
COP
20825C104
6291
0.37%
$766,809.99
Intuitive Surgical Inc
ISRG
46120E602
1575
0.36%
$743,652.00
Honeywell International Inc
HON
438516106
3100
0.35%
$726,950.00
Lowe's Cos Inc
LOW
548661107
2951
0.34%
$701,128.09
QUALCOMM Inc
QCOM
747525103
5309
0.33%
$689,214.38
Deere & Co
DE
244199105
1165
0.32%
$672,787.50
Lockheed Martin Corp
LMT
539830109
1023
0.32%
$660,858.00
Blackrock Inc
BLK
09290D101
699
0.31%
$645,952.89
Booking Holdings Inc
BKNG
09857L108
151
0.31%
$640,430.26
Intuit Inc
INTU
461202103
1438
0.31%
$632,662.48
Bristol-Myers Squibb Co
BMY
110122108
10636
0.30%
$628,374.88
Accenture PLC
ACN
G1151C101
3187
0.30%
$626,723.55
ServiceNow Inc
NOW
81762P102
5382
0.30%
$611,502.84
Altria Group Inc
MO
02209S103
8846
0.29%
$600,554.94
Medtronic PLC
MDT
G5960L103
6787
0.29%
$591,419.18
Danaher Corp
DHR
235851102
3126
0.28%
$585,562.32
Comcast Corp
CMCSA
20030N101
19317
0.28%
$582,600.72
Southern Co/The
SO
842587107
5928
0.28%
$581,003.28
Starbucks Corp
SBUX
855244109
5771
0.28%
$572,194.65
Capital One Financial Corp
COF
14040H105
3170
0.27%
$569,934.30
Duke Energy Corp
DUK
26441C204
4133
0.27%
$550,308.95
T-Mobile US Inc
TMUS
872590104
2481
0.26%
$539,344.59
Adobe Inc
ADBE
00724F101
2081
0.25%
$518,834.92
CVS Health Corp
CVS
126650100
6705
0.25%
$510,451.65
AMERICAN TOWER CORP
AMT
03027X100
2420
0.22%
$446,272.20
US Bancorp
USB
902973304
8234
0.20%
$419,934.00
Bank of New York Mellon Corp/The
BK
064058100
3566
0.20%
$414,262.22
General Dynamics Corp
GD
369550108
1139
0.19%
$400,381.28
Mondelez International Inc
MDLZ
609207105
7137
0.19%
$391,749.93
Emerson Electric Co
EMR
291011104
2908
0.19%
$384,553.92
Colgate-Palmolive Co
CL
194162103
4215
0.18%
$374,460.60
3M Co
MMM
88579Y101
2470
0.18%
$372,871.20
FedEx Corp
FDX
31428X106
1047
0.18%
$368,208.96
United Parcel Service Inc
UPS
911312106
3598
0.17%
$349,761.58
Simon Property Group Inc
SPG
828806109
1670
0.15%
$311,989.40
NIKE Inc
NKE
654106103
5688
0.15%
$307,038.24
General Motors Co
GM
37045V100
4097
0.14%
$296,581.83
Target Corp
TGT
87612E106
2159
0.12%
$253,337.06
PayPal Holdings Inc
PYPL
70450Y103
4877
0.11%
$218,977.30
American International Group Inc
AIG
026874784
2751
0.10%
$209,873.79
MetLife Inc
MET
59156R108
3019
0.10%
$205,201.43
Cash & Other
Cash&Other
Cash&Other
158350.99
0.08%
$158,350.99
Versant Media Group Inc
VSNT
925283103
697
0.01%
$26,172.35
SPXW US 03/19/26 P6325
SPXW 260319P06325000
-5
0.00%
$-7,600.00
SPXW US 03/19/26 P6225
SPXW 260319P06225000
5
0.00%
$4,450.00
SPXW US 03/18/26 P6275
SPXW 260318P06275000
5
0.00%
$3,910.00
S&P DOW PUT OPT 03/26 6535
SPXW 260313P06535000
-2
0.00%
$-6.00
SPXW US 03/18/26 P6375
SPXW 260318P06375000
-5
0.00%
$-7,060.00
ETF holdings and allocations are subject to change at any time and should not be interpreted as an offer of these securities.

Historical Premium/Discount

N/A

IMPORTANT INFORMATION

1Premium/Discount If the price of the ETF is trading above its NAV, the ETF is said to be trading at a “premium.” Conversely, if the price of the ETF is trading below its NAV, the ETF is said to be trading at a “discount.” In relatively calm markets, ETF prices and NAV generally stay close.
230-Day Median Bid/Ask Spread % A calculation of the Fund's median bid-ask spread, expressed as a percentage rounded to the nearest hundredth, computed by: identifying the Fund's national best bid and national best offer as of the end of each 10 second interval during each trading day of the last 30 calendar days; dividing the difference between each such bid and offer by the midpoint of the national best bid and national best offer; and identifying the median of those values.

Important Risk Information

Carefully consider the Fund's investment objectives, risk factors, charges, and expenses before investing. This and additional information can be found in The SGI Market Leaders ETF's Read the prospectus carefully before investing.
Investing involves risk, including possible loss of principal. The Fund is a newly organized, diversified management investment company with no operating history. Securities that can be converted into common stock, such as certain securities and preferred stock, are subject to the usual risks associated with fixed income investments, such as interest rate risk and credit risk. The Fund’s investments in derivative instruments including options, forward currency exchange contracts, swaps and futures, which may be leveraged, may result in losses. Investments in derivative instruments may result in losses exceeding the amounts invested. An option is a type of derivative instrument that gives the holder the right (but not the obligation) to buy (a “call”) or sell (a “put”) an asset in the near future at an agreed upon price prior to the expiration date of the option.
The Fund’s investment performance may be affected by the investment performance of the underlying funds in which the Fund may invest. The Fund is non-diversified. Compared to other funds, the Fund may invest more of its assets in a smaller number of companies. Gains or losses on a single stock may have greater impact on the Fund.
Shares of any ETF are bought and sold at market price (not NAV), may trade at a discount or premium to NAV and are not individually redeemed from the funds. Brokerage commissions will reduce returns.
Distributed by Quasar Distributors, LLC.