SGI Enhanced Global Income ETF

May 10, 2024

CURRENT MATERIALS

CURRENT MATERIALS

Overview

INCEPTION
02/29/2024
OBJECTIVE
Seeks income
TICKER
GINX
PRIMARY EXCHANGE
NASDAQ
CUSIP
74933W262
NET ASSETS
$56,187,310.41
PREMIUM/DISCOUNT1
0.07%
30 DAY MEDIAN BID/ASK SPREAD2
0.19%
GROSS EXPENSE RATIO
0.98%

Seeking Higher Income from Equity Exposure

The SGI Global Enhanced Income ETF (GINX) seeks to generate current income and enhanced yield by actively investing in global companies (primarily large- and mid-cap) that currently offer dividend income. Emphasizing reduced volatility through disciplined value investment, our goal is to outperform and receive higher dividend yields when compared to the underlying indices.

GINX uses an innovative, actively traded put and call options methodology that harnesses exposure to the S&P 500 Index or other broad benchmark indices, but with a dedicated emphasis on risk control. We believe this gives GINX increased potential of providing improved yield compared to traditional option-based strategies.

Why invest in GINX?

Income Generation

Designed for investors looking to experience income derived from two distinct sets of holdings: 1) dividends that are generated from a diversified portfolio of global equities that historically generate attractive dividends, and 2) an enhanced income component derived from an ultra-short-term options strategy that seeks to provide additional daily income.

Diversification

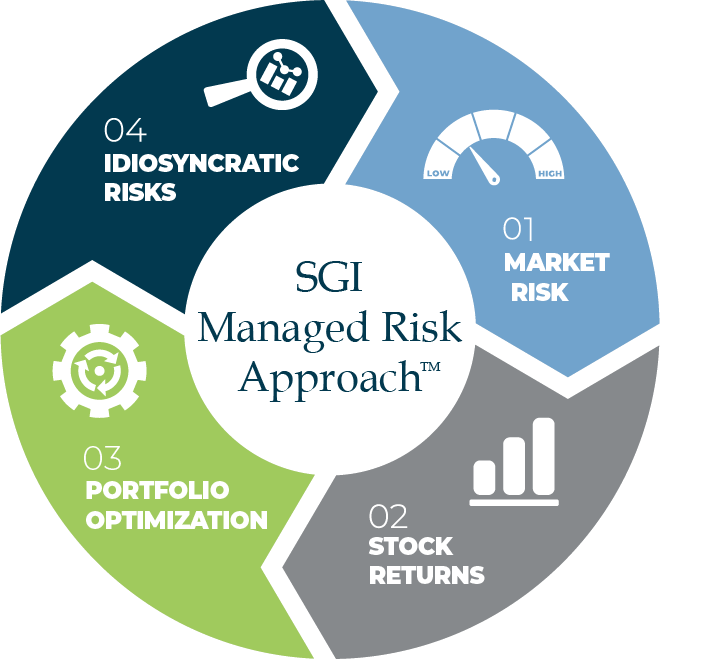
Invests across a diversified portfolio of global companies that exhibit attractive growth characteristics— growth potential and quality of earnings—with an emphasis on current dividends, while seeking downside protection through our Managed Risk ApproachTM.

Experienced Investment Team

SGI Portfolio Managers have deep expertise in multi-asset income investing, including asset allocation, tactical positioning, and rigorous research.

Risk Management

Managed Risk ApproachTM utilizes dynamic hedging through call options or underlying futures.

Managed Risk Approach

Performance

DAILY PERFORMANCE
AS OF 2024-05-10

NAV
PRICE
$ Change
$25.95
$25.97
% Change
0.15%
0.17%

Portfolio Managers

Aash M. Shah, CFA

Head of Investments & Sr. Portfolio Manager

David Harden, Founder

President | Portfolio Manager | Chief Executive Officer | Chief Investment Officer

Holdings as of 2024-05-10

Name
Ticker
CUSIP
Shares
Weight
Market Value
Novo Nordisk A/S
NVO
670100205
15231
3.48%
$1,955,965.02
Equinor ASA
EQNR
29446M102
63425
3.22%
$1,809,515.25
Apple Inc
AAPL
037833100
9803
3.19%
$1,794,439.15
Alphabet Inc
GOOG
02079K107
10270
3.11%
$1,748,878.30
Coca-Cola Femsa SAB de CV
KOF
191241108
16522
2.94%
$1,650,382.58
UnitedHealth Group Inc
UNH
91324P102
3149
2.87%
$1,614,838.69
Shinhan Financial Group Co Ltd
SHG
824596100
45503
2.83%
$1,592,149.97
Meta Platforms Inc
META
30303M102
3089
2.62%
$1,470,981.80
JPMORGAN CHASE & CO.
JPM
46625H100
7349
2.60%
$1,460,760.73
Bancolombia SA
CIB
05968L102
42579
2.59%
$1,457,053.38
Merck & Co Inc
MRK
58933Y105
11025
2.55%
$1,433,911.50
Civitas Resources Inc
CIVI
17888H103
17984
2.44%
$1,370,021.12
TIM SA/Brazil
TIMB
88706T108
83838
2.42%
$1,360,690.74
GSK PLC
GSK
37733W204
28619
2.30%
$1,289,858.33
Mastercard Inc
MA
57636Q104
2739
2.23%
$1,251,668.22
First American Government Obligations Fund
FGXXX
31846V336
1099072.85
1.96%
$1,099,072.85
Chord Energy Corp
CHRD
674215207
6072
1.94%
$1,089,863.28
Telefonica Brasil SA
VIV
87936R205
115884
1.80%
$1,013,985.00
TJX Cos Inc/The
TJX
872540109
10065
1.77%
$994,522.65
Applied Materials Inc
AMAT
038222105
3822
1.43%
$801,588.06
Walmart Inc
WMT
931142103
12566
1.35%
$759,991.68
Lam Research Corp
LRCX
512807108
796
1.30%
$728,674.32
Humana Inc
HUM
444859102
2116
1.26%
$710,108.44
ServiceNow Inc
NOW
81762P102
892
1.16%
$650,972.68
KB Financial Group Inc
KB
48241A105
10548
1.09%
$610,834.68
National Grid PLC
NGG
636274409
8081
1.02%
$575,448.01
Booking Holdings Inc
BKNG
09857L108
150
1.02%
$570,862.50
Chevron Corp
CVX
166764100
3265
0.96%
$541,402.30
INFOSYS LTD
INFY
456788108
31671
0.95%
$534,289.77
EOG Resources Inc
EOG
26875P101
4039
0.94%
$525,473.90
Microsoft Corp
MSFT
594918104
1195
0.88%
$495,614.30
Banco Bilbao Vizcaya Argentaria SA
BBVA
05946K101
44222
0.82%
$459,908.80
Evergy Inc
EVRG
30034W106
8008
0.79%
$443,803.36
QUALCOMM Inc
QCOM
747525103
2422
0.78%
$440,997.76
NETEASE INC
NTES
64110W102
4428
0.78%
$436,290.84
TFI International Inc
TFII
87241L109
3013
0.74%
$414,799.71
Bristol-Myers Squibb Co
BMY
110122108
8674
0.69%
$389,809.56
Union Pacific Corp
UNP
907818108
1573
0.69%
$389,160.20
United Parcel Service Inc
UPS
911312106
2523
0.66%
$371,814.51
Ambev SA
ABEV
02319V103
159636
0.66%
$370,355.52
Home Depot Inc/The
HD
437076102
1036
0.64%
$358,901.48
Coca-Cola Co/The
KO
191216100
5655
0.64%
$357,735.30
TELUS Corp
TU
87971M103
21913
0.63%
$352,799.30
Rio Tinto PLC
RIO
767204100
5018
0.62%
$350,256.40
ELEVANCE HEALTH INC
ELV
036752103
643
0.62%
$346,692.74
Hershey Co/The
HSY
427866108
1553
0.57%
$318,023.34
PDD Holdings Inc
PDD
722304102
2279
0.55%
$310,559.33
Unilever PLC
UL
904767704
5801
0.55%
$310,411.51
America Movil SAB de CV
AMX
02390A101
14812
0.53%
$298,758.04
Pfizer Inc
PFE
717081103
10597
0.53%
$296,821.97
Brookfield Corp
BN
11271J107
6704
0.53%
$296,517.92
UBS Group AG
UBS
H42097107
9852
0.52%
$292,604.40
Crowdstrike Holdings Inc
CRWD
22788C105
911
0.52%
$292,212.36
Amazon.com Inc
AMZN
023135106
1558
0.52%
$292,093.84
GoDaddy Inc
GDDY
380237107
2176
0.52%
$291,409.92
UFP Industries Inc
UFPI
90278Q108
2466
0.52%
$291,185.28
ING Groep NV
ING
456837103
16822
0.52%
$290,852.38
American International Group Inc
AIG
026874784
3607
0.51%
$288,956.77
Prudential Financial Inc
PRU
744320102
2426
0.51%
$288,281.58
Colgate-Palmolive Co
CL
194162103
3005
0.51%
$285,775.50
Entergy Corp
ETR
29364G103
2510
0.50%
$281,094.90
Bank of New York Mellon Corp/The
BK
064058100
4726
0.49%
$276,187.44
Alibaba Group Holding Ltd
BABA
01609W102
3450
0.49%
$276,138.00
CSX Corp
CSX
126408103
7949
0.49%
$273,286.62
Ares Management Corp
ARES
03990B101
1915
0.48%
$272,447.05
Berkshire Hathaway Inc
BRK/B
084670702
661
0.48%
$272,365.05
Shell PLC
SHEL
780259305
3674
0.48%
$272,206.66
ICICI Bank Ltd
IBN
45104G104
10142
0.48%
$271,704.18
Lockheed Martin Corp
LMT
539830109
579
0.48%
$271,481.52
Banco Santander SA
SAN
05964H105
53528
0.48%
$269,245.84
Netflix Inc
NFLX
64110L106
440
0.48%
$268,782.80
Automatic Data Processing Inc
ADP
053015103
1087
0.48%
$268,336.82
Micron Technology Inc
MU
595112103
2212
0.48%
$268,182.88
Kimberly-Clark Corp
KMB
494368103
1961
0.48%
$268,009.87
S&P Global Inc
SPGI
78409V104
613
0.47%
$264,552.41
DR Horton Inc
DHI
23331A109
1764
0.47%
$264,547.08
Air Products and Chemicals Inc
APD
009158106
1050
0.47%
$263,077.50
Eni SpA
E
26874R108
8054
0.47%
$262,882.56
Exxon Mobil Corp
XOM
30231G102
2227
0.47%
$262,696.92
Deere & Co
DE
244199105
644
0.47%
$262,681.16
PACCAR Inc
PCAR
693718108
2396
0.47%
$261,595.28
Janus Henderson Group PLC
JHG
G4474Y214
7999
0.46%
$261,167.35
Honda Motor Co Ltd
HMC
438128308
7683
0.46%
$259,531.74
Centene Corp
CNC
15135B101
3334
0.46%
$259,351.86
Procter & Gamble Co/The
PG
742718109
1548
0.46%
$258,283.80
CRH PLC
CRH
G25508105
3080
0.46%
$258,011.60
PepsiCo Inc
PEP
713448108
1426
0.46%
$256,380.54
Cash & Other
Cash&Other
Cash&Other
255125.41
0.45%
$255,125.41
Lennar Corp
LEN
526057104
1556
0.45%
$253,519.08
NIKE Inc
NKE
654106103
2758
0.45%
$250,812.52
Sysco Corp
SYY
871829107
3286
0.45%
$250,294.62
Vipshop Holdings Ltd
VIPS
92763W103
15608
0.44%
$248,167.20
Ferguson PLC
FERG
G3421J106
1116
0.44%
$247,227.48
Cia Energetica de Minas Gerais
CIG
204409601
99726
0.44%
$246,323.22
Target Corp
TGT
87612E106
1500
0.44%
$244,695.00
BlackRock Inc
BLK
09247X101
307
0.44%
$244,577.69
POSCO Holdings Inc
PKX
693483109
3338
0.43%
$243,206.68
Broadcom Inc
AVGO
11135F101
179
0.42%
$238,571.20
FedEx Corp
FDX
31428X106
897
0.42%
$238,359.81
Sanofi SA
SNY
80105N105
4799
0.42%
$236,494.72
Aon PLC
AON
G0403H108
784
0.41%
$229,790.40
McDonald's Corp
MCD
580135101
824
0.40%
$226,600.00
Ryanair Holdings PLC
RYAAY
783513203
1748
0.40%
$226,103.80
Skyworks Solutions Inc
SWKS
83088M102
2379
0.39%
$219,343.80
SPXW US 05/10/24 P5110
SPXW 240510P05110000
-150
0.00%
$-750.00
SPXW US 05/10/24 P5145
SPXW 240510P05145000
-500
0.00%
$-2,500.00
SPXW US 05/10/24 C5270
SPXW 240510C05270000
-9
0.00%
$-45.00
SPXW US 05/10/24 C5275
SPXW 240510C05275000
-301
0.00%
$-1,505.00
SPXW US 05/10/24 C5285
SPXW 240510C05285000
-350
0.00%
$-1,750.00
SPXW US 05/10/24 P5140
SPXW 240510P05140000
-150
0.00%
$-750.00
ETF holdings and allocations are subject to change at any time and should not be interpreted as an offer of these securities.

Historical Premium/Discount

Important Risk Information

Carefully consider the Fund's investment objectives, risk factors, charges, and expenses before investing. This and additional information can be found in The SGI Global Income ETF's prospectus. Read the prospectus carefully before investing.
Investing involves risk, including possible loss of principal. The Fund is a newly organized, diversified management investment company with no operating history. To the extent the Fund invests in Underlying Funds that invest in fixed income securities, the Fund will be subject to fixed income securities risks. While fixed income securities normally fluctuate less in price than stocks, there have been extended periods of increases in interest rates that have caused significant declines in fixed income securities prices. To the extent that a Fund invests in Underlying Funds that invest in high-yield securities and unrated securities of similar credit quality (commonly known as “junk bonds”), the Fund may be subject to greater levels of interest rate and credit risk than funds that do not invest in such securities. Small cap companies that the Underlying Funds may invest in may be more volatile than, and not as readily marketable as, those of larger companies. Small companies may also have limited product lines, markets or financial resources and may be dependent on relatively small or inexperienced management groups. Underlying Funds that invest in foreign securities may be subject to special risks, including, but not limited to, currency exchange rate volatility, political, social, or economic instability, less publicly available information, less stringent investor protections and differences in taxation, auditing and other financial practices. Investments in emerging market securities by Underlying Funds are subject to higher risks than those in developed countries because there is greater uncertainty in less established markets and economies. To the extent the Fund invests in Underlying Funds that focus their investments in a particular industry or sector, the Fund’s shares may be more volatile and fluctuate more than shares of a fund investing in a broader range of securities. A company issuing dividend-paying securities may fail and have to decrease or eliminate its dividend. In such an event, the Fund may not only lose the dividend payout, but the stock price of the company may fall. The Fund’s investments in derivative instruments including options, forward currency exchange contracts, swaps, and futures, which may be leveraged, may result in losses. Investments in derivative instruments may result in losses exceeding the amounts invested. The use of derivatives is a highly specialized activity that involves investment techniques and risks different from those associated with investments in more traditional securities and instruments.
Diversification does not eliminate the risk of experiencing investment loss.
Shares of any ETF are bought and sold at market price (not NAV), may trade at a discount or premium to NAV and are not individually redeemed from the funds. Brokerage commissions will reduce returns.
Distributed by Quasar Distributors, LLC.